2025 Customer Service Performance Indicators
April 13, 2025Unlocking Customer Service Excellence: The Power of Metrics
Want to deliver outstanding customer service? This listicle reveals ten essential customer service performance indicators to help you achieve just that. Learn how tracking metrics like Customer Satisfaction Score (CSAT), Net Promoter Score (NPS), First Contact Resolution (FCR), and others can pinpoint areas for improvement and boost customer loyalty. Using these customer service performance indicators empowers data-driven decisions to refine your support operations and elevate customer satisfaction.
1. Customer Satisfaction Score (CSAT)
Customer Satisfaction Score (CSAT) is a key customer service performance indicator that measures how satisfied customers are with a specific interaction, product, or service. It provides a snapshot of customer sentiment immediately following a particular touchpoint, such as a support interaction, purchase, or onboarding experience. CSAT is typically measured through short surveys asking customers to rate their satisfaction on a numerical scale, most commonly 1-5 or 1-10. For example, a question might be phrased as "How would you rate your satisfaction with the support you received today?" The results are then calculated as the percentage of customers who selected the top scores (4 or 5 on a 5-point scale, or 7-10 on a 10-point scale). These top scores represent “satisfied” customers.

CSAT's simplicity makes it easy to implement, understand, and track. It provides immediate feedback on specific areas within the customer journey, allowing businesses to pinpoint strengths and weaknesses quickly. You can also segment CSAT scores by customer type, product, or service line for more granular insights. For instance, a SaaS company might measure CSAT for different features within its software to understand which areas are delighting users and which require improvement. This granular approach allows businesses to tailor their service strategies and product development roadmaps more effectively. Learn more about Customer Satisfaction Score (CSAT)
Features and Benefits:
- Simple and Understandable: Easy to implement and interpret, even for those without a statistical background.
- Immediate Feedback: Provides real-time insights into specific customer interactions.
- Segmentable: Allows for analysis by customer segments, products, or service lines.
- Actionable Insights: Helps pinpoint areas for improvement and optimize specific touchpoints.
- Benchmarking: Facilitates comparison against industry standards and competitors.
Pros:
- Easy for Customers: Short and simple surveys encourage higher response rates.
- Actionable Data: Provides specific feedback on individual interactions.
- Fast Identification of Issues: Quickly highlights problem areas and negative experiences.
- Benchmarking Capabilities: Allows for comparisons against industry best practices.
- Trackable Progress: Easy to monitor improvements over time.
Cons:
- Response Bias: Prone to feedback primarily from extremely satisfied or dissatisfied customers.
- Limited Scope: May not capture the holistic customer experience.
- Weak Correlation with Loyalty: High CSAT doesn't always translate to long-term customer loyalty.
- Cultural Variations: Scoring patterns can be influenced by cultural differences.
- Recency Bias: Scores can be heavily influenced by the most recent interaction.
Examples of Successful Implementation:
- Apple: Measures CSAT after each Genius Bar appointment to ensure customer satisfaction with technical support.
- Amazon: Solicits order satisfaction ratings after purchases to track fulfillment and delivery performance.
- Zappos: Utilizes CSAT to maintain their exceptional customer service standards and identify areas for improvement.
- Atlassian: Measures CSAT for customer support interactions to gauge the effectiveness of their support team.
Tips for Effective CSAT Implementation:
- Keep Surveys Short: Minimize the time commitment required from customers.
- Timely Feedback: Request feedback immediately following the interaction.
- Follow Up on Negative Feedback: Reach out to dissatisfied customers to address their concerns and improve the experience.
- Set Benchmarks: Establish internal targets based on industry standards and competitor performance.
- Combine with Qualitative Data: Gather open-ended feedback to provide context and deeper understanding.
CSAT’s value lies in its ability to provide immediate feedback on specific customer interactions. It deserves a prominent place in any list of customer service performance indicators because it offers actionable insights for optimizing individual touchpoints and quickly addressing customer pain points. While it shouldn’t be the sole metric used, CSAT is a powerful tool for improving customer satisfaction and driving positive change within customer-facing teams. This makes it highly relevant for our target audience, including Customer Support Teams, IT Help Desk Professionals, Businesses Handling High Volume Inquiries, SaaS companies, and any organization leveraging digital channels for customer service. By understanding and effectively utilizing CSAT, businesses can create more positive customer experiences and foster stronger relationships.
2. Net Promoter Score (NPS)
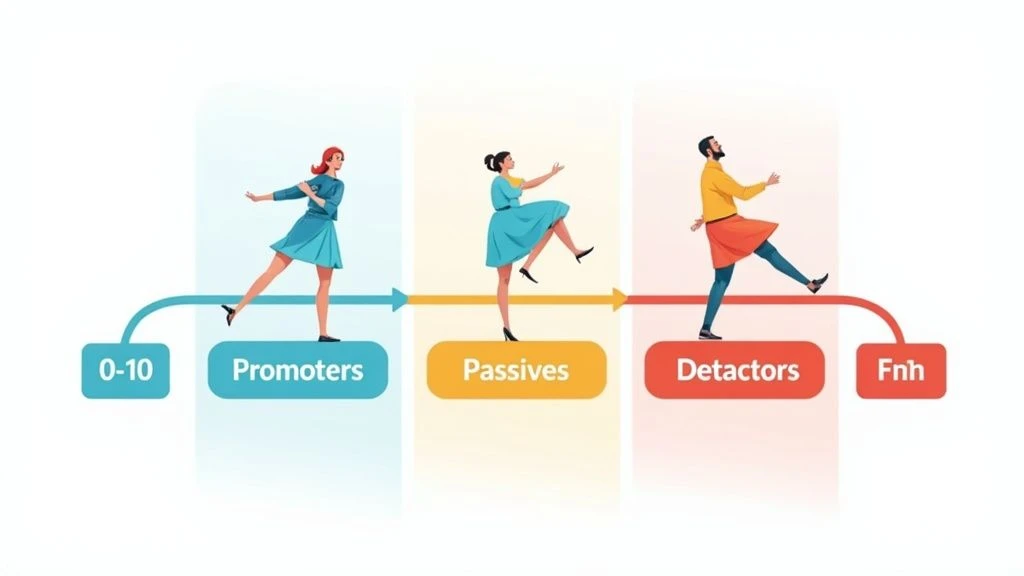
Net Promoter Score (NPS) is a crucial customer service performance indicator that gauges customer loyalty and predicts business growth. It boils down to a single, straightforward question: "On a scale of 0-10, how likely are you to recommend our company/product/service to a friend or colleague?" Based on their responses, customers are categorized into three groups: Detractors (0-6), Passives (7-8), and Promoters (9-10). The NPS itself is calculated by subtracting the percentage of Detractors from the percentage of Promoters, resulting in a score ranging from -100 to +100. A higher score indicates a stronger customer base, more likely to generate positive word-of-mouth referrals and drive future growth.
This metric deserves a place on any list of essential customer service performance indicators because of its simplicity, proven correlation with revenue growth, and widespread adoption. Its single-question format makes it easy to implement and understand for both customers and businesses. By focusing on the likelihood of recommendation, NPS taps into the core of customer loyalty and identifies potential brand advocates. This focus on advocacy makes it particularly relevant for SaaS companies and digital service providers who rely heavily on word-of-mouth marketing.
Features and Benefits:
- Single question simplicity: Easy for customers to answer and for businesses to analyze.
- Measures customer loyalty and potential for word-of-mouth marketing: Directly addresses the likelihood of referrals, a key driver of organic growth.
- Categorizes customers: Segmentation into Promoters, Passives, and Detractors allows for targeted follow-up and improvement strategies.
- Clear metric: The -100 to +100 scale provides a readily understandable benchmark for performance tracking and comparison.
- Open-ended follow-up question: Allows for deeper qualitative insights into the reasons behind the scores. This is particularly valuable for customer support teams and IT help desk professionals who can use this feedback to address specific pain points and improve service delivery.
Pros:
- Simple to implement and understand
- Strong correlation with revenue growth
- Widely adopted across industries, allowing for benchmarking
- Identifies loyal customers who drive referrals
- Easy to track over time
Cons:
- Doesn't provide specific reasons for scores without follow-up questions
- Cultural biases can affect scoring patterns
- May oversimplify complex customer relationships
- Doesn't capture specific areas for improvement without additional context
- Can be manipulated if employees pressure customers for high scores
Examples of Successful Implementation:
- Apple: Known for exceptionally high NPS scores, often ranking among the highest across industries.
- Ritz-Carlton: Uses NPS to maintain its luxury service standards and identify areas for improvement.
- Airbnb: Leverages NPS to measure both host and guest satisfaction, ensuring a positive experience for all users.
- Slack: Achieved an NPS of 40+, which is considered excellent for SaaS companies.
Tips for Effective NPS Utilization:
- Always include a follow-up question: Asking "Why did you give that score?" provides invaluable qualitative data.
- Survey customers at regular intervals: Don't limit NPS surveys to post-purchase interactions. Regular feedback provides a continuous pulse on customer sentiment.
- Close the loop with detractors: Personal outreach demonstrates a commitment to addressing concerns and improving the customer experience. This is especially important for businesses handling high volume inquiries.
- Segment NPS by customer type, product line, or geography: This granular approach provides more actionable insights.
- Use transactional and relationship NPS for different insights: Transactional NPS focuses on specific interactions, while relationship NPS measures overall loyalty.
Popularized By:
- Fred Reichheld (introduced NPS in 2003)
- Bain & Company (helped develop and popularize the metric)
- Satmetrix (co-developer of the NPS methodology)
By leveraging NPS effectively, organizations can gain a deep understanding of customer loyalty, identify areas for improvement in their customer service workflows, and ultimately drive sustainable business growth. For businesses seeking workflow automation, NPS data can highlight areas where automation can improve the customer experience, leading to higher satisfaction and ultimately, a higher NPS. For organizations and individuals using email for customer support, embedding NPS surveys within email communications can provide valuable feedback and improve email-based support processes.
3. First Contact Resolution (FCR)
First Contact Resolution (FCR) is a crucial customer service performance indicator that measures the percentage of customer inquiries resolved during the initial interaction, eliminating the need for follow-ups or escalations. A high FCR rate signifies efficient and effective customer service, demonstrating the team's ability to address customer needs promptly. This reduces customer effort, leading to increased satisfaction and loyalty. FCR is a powerful metric for understanding how well your support team is performing and identifying areas for improvement within your customer service workflow. By focusing on FCR, businesses can streamline operations, enhance customer experience, and ultimately boost their bottom line.

FCR applies across all communication channels, including phone, email, chat, and social media. It is typically expressed as a percentage and can be measured through system data or post-interaction surveys. Tracking resolution rates on the first interaction provides valuable insights into agent performance, knowledge gaps, and training needs. This metric strongly correlates with customer satisfaction, making it a key indicator of overall customer experience. For a deeper dive on how FCR interacts with helpdesk software, you can learn more about First Contact Resolution (FCR).
Features and Benefits:
- Tracks resolution rates on first interaction: Provides a clear picture of immediate resolution effectiveness.
- Applies across channels: Offers a holistic view of customer service performance across all communication platforms.
- Usually expressed as a percentage: Allows for easy benchmarking and progress tracking.
- Can be measured through system data or post-interaction surveys: Offers flexibility in data collection methods.
- Strongly correlates with customer satisfaction: Provides a direct link between FCR and customer happiness.
Pros:
- Directly impacts customer effort and satisfaction: Reduces customer frustration and improves their overall experience.
- Reduces operational costs by minimizing repeat contacts: Frees up agents to handle new inquiries and reduces overall workload.
- Identifies knowledge gaps in support teams: Highlights areas where agents require further training or resources.
- Helps optimize staffing and training needs: Enables data-driven decisions about resource allocation.
- Provides clear ROI with each percentage point improvement: Demonstrates the tangible benefits of investing in FCR improvement initiatives.
Cons:
- May encourage quick but incomplete resolutions: Agents might prioritize speed over thoroughness, leading to recurring issues.
- Difficult to standardize across different issue types: Complex issues may inherently require multiple contacts, making comparisons challenging.
- Complex issues may inherently require multiple contacts: Not all inquiries can be resolved on the first attempt.
- Definition of 'resolved' can be subjective: Varying interpretations of resolution can skew data accuracy.
- May not account for quality of resolution: A quick resolution doesn't necessarily equate to a satisfactory one.
Examples of Successful Implementation:
- Companies like Zappos prioritize high FCR rates in their customer service centers, contributing to their renowned customer service reputation.
- American Express has reportedly achieved FCR rates exceeding 90% through comprehensive agent training and empowerment.
- T-Mobile improved its FCR by empowering frontline agents with greater decision-making authority.
- Amazon Web Services enhanced their FCR by developing a comprehensive knowledge base of common solutions.
Tips for Improving FCR:
- Clearly define what constitutes a 'resolved' issue: Establish clear criteria for resolution to ensure consistent measurement and agent understanding.
- Empower agents with authority to solve problems on first contact: Provide agents with the tools and autonomy to handle a wider range of issues independently.
- Invest in comprehensive knowledge management systems: Equip agents with readily accessible information to quickly resolve inquiries.
- Train agents on both technical and soft skills: Develop well-rounded agents capable of handling both technical issues and providing empathetic customer service.
- Create feedback loops between issue types and training programs: Continuously analyze common issue types and tailor training programs accordingly.
FCR deserves a prominent place on the list of customer service performance indicators because it directly reflects the efficiency and effectiveness of customer service operations. By prioritizing FCR, businesses can significantly improve customer satisfaction, reduce operational costs, and gain a competitive edge. This metric is especially relevant for Customer Support Teams, IT Help Desk Professionals, businesses handling high-volume inquiries, organizations seeking workflow automation, SaaS companies and digital service providers, and those utilizing email for customer support. Focusing on FCR is an investment in both customer happiness and operational excellence.
4. Average Resolution Time
Average Resolution Time (ART) is a crucial customer service performance indicator that measures the average duration it takes to completely resolve a customer issue, from the initial point of contact to the final resolution. This metric provides valuable insights into the efficiency of your customer service operations and has a direct correlation with customer satisfaction. Faster resolutions typically translate to happier customers, contributing significantly to customer loyalty and positive word-of-mouth referrals. Its importance in evaluating and improving customer service operations earns ART a prominent place among key performance indicators.
How it Works:
ART calculates the total time spent resolving all customer issues within a specific timeframe and divides it by the total number of resolved issues. This includes all interactions, wait times, and internal processes involved in achieving a resolution. It's important to distinguish ART from First Response Time, which only measures the speed of the initial reply. ART provides a more holistic view of the entire resolution process.
Features and Benefits:
- Measures Time from Issue Creation to Complete Resolution: ART offers a comprehensive understanding of the entire customer journey from problem initiation to final solution.
- Segmentation Capabilities: Data can be segmented by issue type (e.g., technical, billing, product related), complexity (e.g., simple requests, complex troubleshooting), or department, allowing for more granular analysis and targeted improvements.
- Comprehensive Time Measurement: ART accounts for all time spent, including wait times between interactions, providing a realistic picture of the customer experience.
- Operational Efficiency Insights: By identifying bottlenecks and inefficiencies in resolution workflows, ART enables data-driven optimization.
Pros:
- Direct Impact on Customer Satisfaction: Faster resolutions demonstrably improve customer happiness.
- Bottleneck Identification: ART highlights areas where the resolution process lags, facilitating targeted improvements.
- Staffing Forecasts: Accurate ART data allows for better prediction of staffing needs based on anticipated case volume and complexity.
- Comparative Analysis: Compare ART across teams, departments, or issue types to identify best practices and areas for improvement.
- Operational Efficiency Correlation: ART serves as a strong indicator of overall operational efficiency within customer service.
Cons:
- Potential for Rushing: Overemphasis on reducing ART can inadvertently encourage agents to rush through complex issues, potentially leading to incomplete resolutions and repeat contacts.
- Complexity Oversights: Without proper segmentation, ART may not accurately reflect the varying levels of complexity associated with different issue types.
- Customer-Caused Delays: External factors like delayed customer responses can skew ART metrics, making it important to consider these variables.
- Channel Variations: Different communication channels (e.g., phone, email, chat) have inherent differences in typical resolution times. Establish realistic expectations for each channel.
- Conflict with Quality Metrics: Focusing solely on reducing ART without considering quality can negatively impact the overall customer experience.
Examples of Successful Implementation:
- HubSpot: Significantly reduced their ART by 60% by implementing AI-powered knowledge base suggestions that empower agents to quickly find relevant solutions.
- Nordstrom: Sets specific ART targets tailored to different issue categories, ensuring appropriate service levels for varying customer needs.
- Shopify: Improved resolution times through the creation of specialized product support teams, demonstrating the effectiveness of targeted expertise.
- Buffer: Publicly shares their ART data as part of their transparency policy, building trust and demonstrating accountability to their customers.
Actionable Tips for Improvement:
- Segment by Complexity: Categorize issues based on complexity to gain more meaningful insights and establish appropriate resolution time targets.
- Set Realistic Targets: Define achievable ART goals based on the specific nature of different problem types and communication channels.
- Automate Workflows: Implement automated workflows to reduce administrative delays and free up agent time for more complex issues.
- Template Responses: Create pre-written template responses for common issues to expedite the resolution process.
- Balance Speed with Quality: Prioritize both speed and quality of resolution to ensure a positive and effective customer experience.
When and Why to Use ART:
ART is a valuable metric for any organization that interacts with customers. Use it to:
- Monitor performance: Track progress and identify trends in resolution efficiency.
- Identify areas for improvement: Pinpoint bottlenecks and areas of friction in customer service processes.
- Enhance customer satisfaction: Reduce resolution times to improve customer happiness and loyalty.
- Optimize resource allocation: Make data-driven decisions about staffing and resource allocation.
By diligently monitoring and optimizing ART, organizations can enhance customer satisfaction, streamline operations, and foster stronger customer relationships. This metric offers invaluable insights into the effectiveness of customer service efforts and provides a clear path towards continuous improvement.
5. Customer Effort Score (CES)
Customer Effort Score (CES) is a crucial customer service performance indicator that measures the ease with which customers can interact with your business. Instead of focusing on customer satisfaction, CES gauges the effort customers exert to resolve issues, use your product, or request a service. This approach stems from the understanding that reducing customer friction significantly impacts loyalty and repurchase behavior. Typically measured on a scale of 1-7 (1 being very difficult and 7 being very easy), CES provides valuable insights into specific touchpoints within the customer journey. A common question used to measure CES is, "How easy was it to handle your issue?" By understanding and minimizing customer effort, businesses can foster stronger customer relationships and reduce churn.
CES deserves its place among key customer service performance indicators because it directly correlates with customer loyalty and future behavior. While traditional satisfaction metrics offer insights into customer feelings, CES provides a more actionable metric focused on identifying and eliminating pain points. Features of CES include its focus on ease of experience, the standard 1-7 scale, measurement at specific touchpoints, and its strong correlation with customer loyalty and repurchase. The benefits are substantial: it often predicts loyalty better than satisfaction scores, pinpoints friction in the customer journey, drives operational improvements for simplified processes, is easy for customers to understand and respond to, and strongly correlates with reduced churn.
Examples of Successful Implementation:
- Amazon's 1-Click ordering: This feature perfectly embodies the principle of reducing customer effort, making purchasing incredibly streamlined.
- USAA: This financial services company leveraged CES to identify and eliminate friction points within their claims process, resulting in a smoother experience for their customers.
- Slack: Prioritizing ease of use as a core product value, Slack regularly measures CES to ensure their platform remains intuitive and user-friendly.
- TD Bank: By using CES, TD Bank redesigned their online banking interface, leading to increased customer retention.
Pros:
- Often a better predictor of loyalty than traditional satisfaction metrics.
- Effectively identifies friction points within the customer journey.
- Drives operational improvements aimed at simplifying processes.
- Easy for customers to understand and respond to.
- Strong correlation with reduced customer churn.
Cons:
- May not fully capture the emotional aspects of the customer experience.
- Might overlook the impact of exceeding customer expectations ("delighting" the customer).
- Being a relatively newer metric, there’s less historical benchmarking data available.
- An excessive focus on reducing effort could potentially lead to minimalist, and perhaps less engaging, experiences.
- May not be suitable for all service contexts.
Actionable Tips for Implementing CES:
- Pair CES with qualitative questions: Ask open-ended questions to understand the why behind the score and uncover specific pain points.
- Measure at multiple touchpoints: Identify the interactions requiring the highest customer effort.
- Focus on reducing steps: Streamline common tasks and make them as efficient as possible.
- Compare CES across different channels: Analyze how effort varies between phone, web, app, and other channels.
- Use journey mapping: Visualize the entire customer journey to pinpoint opportunities for effort reduction.
When and Why to Use CES:
CES is particularly valuable for customer support teams, IT help desk professionals, businesses handling high-volume inquiries, organizations seeking workflow automation, SaaS companies and digital service providers, and organizations utilizing email for customer support. Use CES when you want to:
- Improve customer retention: Reducing churn is a key driver for sustainable growth.
- Streamline processes: Identify and eliminate unnecessary steps in customer interactions.
- Increase customer loyalty: Effortless experiences foster stronger customer relationships.
- Enhance the overall customer experience: Make it easier for customers to do business with you.
While Gartner (formerly CEB) popularized CES through the Harvard Business Review article "Stop Trying to Delight Your Customers" by Matthew Dixon, Karen Freeman, and Nicholas Toman, its practical application has proven invaluable for businesses across numerous industries. By focusing on minimizing customer effort, you can create a smoother, more enjoyable experience that translates into increased loyalty and business success.
6. Customer Retention Rate
Customer Retention Rate (CRR) is a crucial customer service performance indicator that measures the percentage of customers a company keeps over a defined period. While influenced by various factors, customer service quality plays a significant role in whether customers stay or churn. Tracking CRR provides valuable insights into the long-term health and sustainability of your business, directly impacting revenue and profitability. This is why it deserves a prominent place in any list of key customer service performance indicators.
How It Works:
CRR is calculated by subtracting newly acquired customers during a specific period from the total number of customers at the end of that period. This result is then divided by the number of customers at the beginning of the period and multiplied by 100. For example, if you started with 100 customers, gained 20 new customers, and ended the period with 110, your CRR would be ((110-20)/100) * 100 = 90%. This metric is typically calculated monthly, quarterly, or annually.
Why Use It?
CRR provides a clear picture of your business's ability to retain customers, which directly correlates to profitability. Acquiring new customers is significantly more expensive (5-25x more) than retaining existing ones. A high CRR indicates strong customer loyalty, effective service strategies, and a healthy business trajectory. Furthermore, analyzing CRR segmented by customer cohorts or value tiers can reveal specific areas for improvement in customer service delivery and tailor retention strategies.
Features and Benefits:
- Measures Business Sustainability and Loyalty: CRR provides a quantifiable measure of customer loyalty and the long-term health of the business.
- Directly Impacts Revenue and Profitability: Retained customers contribute more to revenue over time, leading to increased profitability.
- Can be Segmented: Analyzing CRR by different customer groups allows for targeted retention strategies.
- Provides Clear ROI for Customer Service Investments: Improvements in customer service quality often directly translate to improved CRR.
Pros:
- Direct Impact on Business Profitability: As mentioned, retention is significantly more cost-effective than acquisition.
- Indicates Long-Term Business Health: A healthy CRR signifies strong customer relationships and sustainable growth.
- Helps Identify Attrition Patterns: Tracking CRR over time can highlight trends and potential issues leading to churn.
- Creates Focus on Customer Lifetime Value: Encourages strategies that maximize the value derived from each customer relationship.
Cons:
- Lagging Indicator: CRR reflects past performance and may not predict future churn.
- Affected by Factors Beyond Customer Service: External market forces can also influence customer retention.
- Can Mask Problems in Aggregate: Segmenting data is crucial to identify hidden issues.
- Doesn't Explain Why: CRR doesn't reveal the reasons behind customer retention or attrition.
Examples of Successful Implementation:
- Netflix: Personalized content recommendations and seamless customer service contribute to high retention rates.
- American Express: Industry-leading retention is achieved through exceptional service and proactive problem resolution.
- Adobe: Moving to a subscription model with ongoing support dramatically increased customer retention.
- USAA: Maintains exceptionally high retention rates (97%+) through service excellence and member-focused policies.
Actionable Tips:
- Segment Retention by Customer Value Tiers: Focus efforts on retaining high-value customers.
- Create Early Warning Systems: Monitor usage patterns and identify at-risk customers proactively.
- Implement Proactive Outreach: Engage with at-risk customers to address potential issues and prevent churn.
- Calculate the Financial Impact of Retention: Understand the monetary value of each percentage point increase in CRR.
- Conduct Exit Interviews/Surveys: Gather feedback from churning customers to understand the reasons for attrition.
Popularized By:
The importance of customer retention has been highlighted by thought leaders like Frederick F. Reichheld and his work on the "loyalty effect." Harvard Business Review's research on customer acquisition costs further solidified the business case for retention. Subscription economy companies like Salesforce have also made retention metrics mainstream.
By focusing on improving customer service and diligently monitoring Customer Retention Rate, businesses can build stronger customer relationships, improve profitability, and ensure long-term success. This metric is invaluable for customer support teams, IT help desks, SaaS companies, and any organization striving to deliver exceptional customer experiences and build a loyal customer base.
7. Average Response Time
Average Response Time (ART) is a crucial customer service performance indicator that measures the time elapsed between a customer initiating contact and receiving the first response from a support agent. It's important to note that this metric focuses solely on the initial response, not the complete resolution of the issue. ART directly impacts customer perception of responsiveness and service quality across all communication channels, making it a key factor in overall customer satisfaction. This is why it deserves a prominent place in any list of essential customer service performance indicators.
This metric works by tracking the duration from the moment a customer sends an email, initiates a chat, makes a phone call, or posts on social media, to the instant a customer service representative sends their first reply. It's crucial to understand that ART is distinct from resolution time, which measures the total time taken to resolve the issue completely. Learn more about Average Response Time and how it impacts your customer support workflow.
Features of Average Response Time:
- Measured from customer contact to first response: The clock starts ticking the moment the customer reaches out and stops when the first agent reply is sent.
- Channel-specific: ART varies significantly across different communication channels (e.g., live chat, email, phone, social media). Customer expectations for response times differ depending on the channel.
- Measured in seconds, minutes, or hours: The unit of measurement depends on the channel and the industry. Live chat often demands responses within seconds, while email might allow for a few hours.
- Distinct from resolution time: ART focuses solely on the initial response, not the total time to resolve the issue.
- Sets customer expectations: A consistently fast ART establishes a benchmark for service quality and manages customer expectations regarding responsiveness.
Pros of Tracking Average Response Time:
- Strong correlation with customer satisfaction: Faster response times generally lead to higher customer satisfaction.
- Easy to measure and track: Modern customer service platforms often provide built-in tools to monitor ART.
- Clearly identifies staffing shortages: Consistently long ARTs can indicate understaffing or inefficient workflows.
- Helps set appropriate customer expectations: Publicly stating target ARTs helps customers understand when to expect a response.
- Allows for comparison across different service channels: Tracking ART separately for each channel allows for targeted improvements.
Cons of Focusing Solely on Average Response Time:
- Prioritization of speed over quality: Overemphasis on speed can lead to rushed, unhelpful responses.
- Potential for agent burnout: Constant pressure to respond quickly can contribute to agent stress and burnout.
- Doesn't account for issue complexity: Complex issues naturally require longer response times, which ART doesn't reflect.
- Varying customer expectations across channels: What's considered a fast response time varies drastically between channels.
- Encourages shortcuts: Focusing solely on speed may incentivize agents to take shortcuts that don't truly benefit the customer.
Examples of Successful ART Implementation:
- Zappos: Known for its exceptional customer service, Zappos reportedly answers 80% of calls within 20 seconds.
- Buffer: This social media management platform typically responds to social media inquiries within 4 hours on average.
- Slack: For paid customers, Slack commits to a first response within 4 hours.
- Amazon Live Chat: Amazon aims for a first response time of within 60 seconds for its live chat support.
Tips for Improving Average Response Time:
- Set channel-specific targets: Establish realistic ART targets for each communication channel based on customer expectations and industry best practices.
- Use auto-acknowledgments: For channels like email, employ automated acknowledgments to inform customers that their message has been received while maintaining transparency about expected response times.
- Implement queue management software: Efficiently distribute incoming inquiries among available agents to minimize wait times.
- Train on balancing speed with quality: Equip agents with the skills and resources to provide helpful and accurate information quickly.
- Use chatbots for initial responses: Deploy chatbots to handle simple inquiries and gather preliminary information, then route the customer to the appropriate human agent when necessary.
By effectively monitoring and managing Average Response Time, businesses can significantly enhance customer satisfaction, improve operational efficiency, and build a reputation for responsiveness and excellent service. This makes ART a vital customer service performance indicator for any organization striving to provide top-tier customer support.
8. Quality Score
Quality Score is a crucial customer service performance indicator that measures how well customer interactions meet predefined quality standards. It provides a quantifiable assessment of agent performance, ensuring consistent service delivery and identifying areas for improvement. This metric deserves its place on the list of key customer service performance indicators because it directly addresses the effectiveness of customer interactions, balancing the often-emphasized efficiency metrics like Average Handle Time. By focusing on quality, businesses can foster customer loyalty, reduce compliance risks, and improve overall service delivery.
Quality Score works by evaluating recorded calls, chat transcripts, or email exchanges against a standardized scorecard. This scorecard typically includes weighted criteria covering various aspects of the interaction, such as:
- Accuracy: Providing correct information and resolving the issue effectively.
- Completeness: Addressing all customer questions and concerns thoroughly.
- Compliance: Adhering to regulatory guidelines and internal policies.
- Soft Skills: Demonstrating empathy, active listening, and a positive attitude.
- Problem-solving Effectiveness: Efficiently identifying and resolving customer issues.
This approach allows for a comprehensive evaluation of the entire customer journey and pinpoints specific training needs. Quality Score is usually expressed as a percentage, offering a clear overview of performance.
Features of Quality Score:
- Evaluates adherence to service quality standards.
- Usually based on a scorecard with weighted criteria.
- Often incorporates compliance and risk management elements.
- Can be measured through manual reviews or AI analysis.
- Typically expressed as a percentage.
Pros:
- Ensures consistent service delivery.
- Identifies specific training needs.
- Balances efficiency metrics with effectiveness.
- Reduces compliance and regulatory risks.
- Provides coaching opportunities for improvements.
Cons:
- Labor-intensive if done manually.
- Subjective elements can lead to inconsistent scoring.
- May create tension with efficiency metrics if not carefully balanced.
- Can feel punitive if not paired with positive reinforcement and coaching.
- May not capture the full spectrum of customer perception.
Examples of Successful Implementation:
- TELUS International: Utilizes AI-assisted quality scoring to evaluate thousands of interactions daily, enhancing efficiency and scalability.
- American Express: Leverages quality scores to identify and recognize top-performing agents, fostering a culture of excellence.
- Discover Card: Incorporates regulatory compliance into their quality scoring framework, mitigating risk and ensuring adherence to industry standards.
- Southwest Airlines: Evaluates quality based on both technical accuracy and emotional connection, prioritizing a positive customer experience.
Actionable Tips for Implementation:
- Involve agents in developing quality standards: Fostering ownership and buy-in.
- Regularly calibrate scoring between different evaluators: Minimizing subjectivity and ensuring consistency.
- Balance technical and soft skill elements in scoring: Addressing both the "what" and the "how" of service delivery.
- Use call/interaction recordings for training examples: Providing concrete examples of best practices and areas for improvement.
- Correlate quality scores with customer satisfaction results: Demonstrating the impact of quality on customer experience.
When and Why to Use Quality Score:
Quality Score is particularly beneficial for:
- Customer Support Teams: Evaluating and improving the quality of support interactions.
- IT Help Desk Professionals: Ensuring accurate and efficient resolution of technical issues.
- Businesses Handling High Volume Inquiries: Maintaining consistent service quality at scale.
- Organizations Seeking Workflow Automation: Identifying areas where automation can enhance quality and efficiency.
- SaaS Companies and Digital Service Providers: Monitoring and optimizing the quality of online interactions.
- Organizations and Individuals Using Email for Customer Support: Evaluating the clarity, completeness, and effectiveness of written communication.
By prioritizing Quality Score as a key customer service performance indicator, businesses can drive continuous improvement, enhance customer satisfaction, and achieve operational excellence. While organizations like COPC, Six Sigma, and J.D. Power have championed the importance of quality in customer service, its relevance remains paramount in today’s competitive landscape.
9. Customer Churn Rate
Customer Churn Rate is a crucial customer service performance indicator that measures the percentage of customers who discontinue using a company's products or services within a specific time frame. While influenced by factors beyond the scope of customer service, like pricing and competition, negative service experiences are a leading driver of churn, making it a vital metric for customer support teams and businesses aiming to improve customer retention. Understanding and monitoring this KPI provides valuable insights into customer satisfaction and loyalty. This is why it deserves a place on the list of essential customer service performance indicators.
How it Works:
Customer Churn Rate is calculated by dividing the number of customers lost during a specific period (e.g., a month, quarter, or year) by the total number of customers at the beginning of that period. The result is then multiplied by 100 to express it as a percentage. For example, if a company starts a month with 1000 customers and loses 50, the churn rate is (50/1000) * 100 = 5%.
Features and Benefits:
- Indicates customer attrition or loss rate: Provides a clear picture of how well a company retains its customer base.
- Flexible Calculation: Can be calculated monthly, quarterly, or annually to align with business needs.
- Segmentation Capabilities: Can be segmented by customer value, tenure, or demographics to pinpoint specific churn patterns.
- Churn Reason Analysis Pairing: Often combined with churn reason analysis (e.g., exit surveys) to identify the root causes of customer attrition.
- Direct Revenue Impact: Directly impacts recurring revenue and growth, making it a financially significant metric.
- Early Warning System: Provides early warnings of potential issues with customer satisfaction and emerging competitive threats.
- Focus on Retention: Creates an organizational focus on customer retention strategies.
Pros:
- Clear Financial Impact: The direct link to revenue makes it easy to prioritize churn reduction initiatives.
- Highlights Emerging Problems: Reveals emerging customer satisfaction problems before they escalate.
- Accurate Revenue Forecasting: Improves the accuracy of future revenue projections.
- Competitive Insight: Provides early warning of competitive threats and market shifts.
- Promotes Retention Focus: Encourages a company-wide focus on customer retention.
Cons:
- Lagging Indicator: Churn is a lagging indicator, meaning it reflects problems that have already occurred.
- External Influences: Influenced by factors outside of customer service, such as pricing, competition, and market conditions.
- Seasonal Variations: Can be seasonally variable in some industries, requiring careful interpretation.
- Root Cause Ambiguity: May not pinpoint the root causes of churn without additional analysis, such as exit surveys.
- Measurement Complexity: Different definitions of an "active customer" can complicate measurement and comparison.
Examples of Successful Implementation:
- Spotify: Reduced churn by leveraging data to create personalized content recommendations and simplifying their customer service processes.
- T-Mobile: The "Un-carrier" initiative significantly reduced churn by implementing customer-friendly policies and service improvements.
- Microsoft Xbox Game Pass: Maintains a low churn rate by consistently adding new game titles and providing responsive customer support.
- Dollar Shave Club: Reduced churn by implementing proactive support and a simplified subscription management system.
Actionable Tips:
- Conduct Exit Surveys: Gather feedback from departing customers to understand service-related churn causes.
- Early Warning Systems: Implement early warning systems that flag at-risk customers based on negative service interactions.
- Dedicated Retention Teams: Create specialized "save teams" focused on retaining at-risk customers.
- Social Media Monitoring: Monitor social media platforms for service complaints that could indicate churn risk.
- Customer Lifetime Value (CLTV): Calculate CLTV to prioritize retention efforts on high-value customers.
When and Why to Use This Approach:
Monitoring Customer Churn Rate is essential for any business, especially those with subscription models or recurring revenue streams. It is particularly relevant for:
- Customer Support Teams: To evaluate the impact of service quality on customer retention.
- IT Help Desk Professionals: To assess the effectiveness of technical support in preventing customer churn.
- SaaS Companies: To understand and improve subscriber retention.
- Digital Service Providers: To monitor customer loyalty and identify areas for service improvement.
By tracking and analyzing Customer Churn Rate, businesses can identify pain points in the customer journey, improve service delivery, and ultimately boost customer loyalty and revenue. This metric is a cornerstone of effective customer service performance management and a key driver of sustainable business growth.
10. Employee Satisfaction/Engagement Score
Employee Satisfaction/Engagement Score is a crucial customer service performance indicator, even though it doesn't directly measure customer interactions. This metric gauges how satisfied and engaged your customer service employees are with their work environment, roles, and the company as a whole. It acknowledges the fundamental principle that happy employees lead to happy customers. By including this in your suite of customer service performance indicators, you’re recognizing the human element at the heart of excellent customer service.
How it Works:
Employee Satisfaction/Engagement Score is typically measured through standardized surveys. These surveys often include questions about:
- Job Satisfaction: How content employees are with their daily tasks and responsibilities.
- Tools and Resources: The adequacy and effectiveness of the tools and technologies provided to perform their jobs.
- Training and Development: Opportunities for professional growth and skill enhancement.
- Management and Leadership: The effectiveness and support provided by supervisors and managers.
- Company Culture: The overall work environment, values, and sense of community.
- eNPS (Employee Net Promoter Score): A specific measure of employee loyalty and their likelihood to recommend the company as a place to work.
The results are typically reported as a percentage or a score out of 100. Regularly tracking this score provides valuable insights into the employee experience and can predict potential customer service issues before they arise.
Why Use It?
This metric deserves a place on this list because research consistently demonstrates a strong correlation between engaged employees and positive customer experiences. Companies with highly engaged employees often see 10-20% higher customer satisfaction (CSAT) scores. Furthermore, tracking employee satisfaction can:
- Predict Turnover: Dissatisfied employees are more likely to leave, leading to service disruptions and increased hiring costs.
- Identify Issues Early: Engagement surveys can reveal management or training issues before they negatively impact customer interactions.
- Improve Customer Experience: Focusing on employee experience lays the foundation for a better customer experience.
- Reduce Costs: Lower turnover rates translate to reduced costs associated with recruiting, hiring, and training new employees.
Examples of Successful Implementation:
- Zappos: Known for its intense focus on company culture and employee engagement, resulting in exceptional customer service.
- Southwest Airlines: Maintains high customer satisfaction through industry-leading employee engagement initiatives.
- Ritz-Carlton: Empowers employees through its "Ladies and Gentlemen serving Ladies and Gentlemen" philosophy, fostering a strong sense of pride and ownership.
- USAA: Maintains employee engagement scores above 85%, contributing significantly to their impressive 97% customer retention rate.
Pros:
- Strong correlation with customer satisfaction.
- Predicts turnover and associated service disruptions.
- Identifies management or training issues early.
- Creates focus on employee experience.
- Reduces costs associated with turnover.
Cons:
- Indirect measure of customer service performance.
- Results can be affected by fear of retaliation.
- May reflect temporary conditions rather than systemic issues.
- Requires organizational commitment to act on findings.
- Can be gamed if tied too directly to management performance.
Actionable Tips:
- Ensure Survey Anonymity: Guarantee anonymity to encourage honest feedback.
- Connect to Customer Metrics: Correlate engagement survey results with customer service metrics like CSAT and NPS to demonstrate the link.
- Regular Measurement: Conduct surveys regularly (e.g., quarterly or monthly pulse checks) to track trends and identify emerging issues.
- Employee Involvement: Involve frontline employees in service improvement initiatives to leverage their insights and increase buy-in.
- Focus on Tools: Recognize the connection between the quality of tools and employee satisfaction. Providing effective tools empowers employees to deliver better service.
Popularized By:
- Gallup's Q12 engagement survey methodology: A widely used framework for measuring employee engagement.
- The Service-Profit Chain concept from Harvard Business School: This research highlights the link between employee satisfaction, customer loyalty, and profitability.
- Great Place to Work certification program: Recognizes companies that prioritize creating positive and engaging work environments.
10 Key Customer Service Performance Metrics Comparison
| Indicator | Implementation Complexity (🔄) | Resource Requirements (⚡) | Expected Outcomes (📊) | Key Advantages (⭐) | Insights/Tips (💡) |
|---|---|---|---|---|---|
| Customer Satisfaction Score (CSAT) | Low complexity; survey-based | Minimal, using short surveys | Immediate feedback on interaction satisfaction | Actionable insights, easy tracking, and benchmarking | Keep surveys brief and ask immediately after interactions |
| Net Promoter Score (NPS) | Simple single-question; moderate follow-ups required | Basic survey tools | Measures customer loyalty and referral potential | Strong revenue correlation and widespread industry use | Always include a follow-up question for score context |
| First Contact Resolution (FCR) | Moderate; clear definition of resolution needed | Requires data tracking systems and agent training | Higher first interaction resolution; reduced repeat contacts | Cost reduction and process efficiency | Clearly define ‘resolved’ and empower agents |
| Average Resolution Time | Moderate; track complete resolution timeline | Needs robust process analytics and system tracking | Faster issue resolution leading to improved customer satisfaction | Identifies bottlenecks and enhances operational insight | Segment time by issue type to set more meaningful targets |
| Customer Effort Score (CES) | Simple; uses single scale surveys | Low resources; integrated into post-interaction feedback | Indicates ease of experience and loyalty predictor | Highlights friction points; drives operational improvements | Pair with qualitative questions to better understand pain points |
| Customer Retention Rate | Moderate; requires historical tracking over periods | Demands a robust CRM and data analytics capability | Demonstrates long-term loyalty and profitability | Direct financial impact and early indicator of attrition | Segment by customer value and monitor exit survey data |
| Average Response Time | Simple measurement; channel-specific variations | Requires queue management and response tracking tools | Faster initial responses which enhance overall service perception | Highlights staffing needs and sets clear service benchmarks | Set tailored response targets for each channel |
| Quality Score | High; involves detailed evaluations (manual or AI-driven) | Significant investment in monitoring systems and training | Ensures consistent adherence to quality standards | Identifies training needs and minimizes compliance risks | Regularly calibrate scoring and involve agents in setting standards |
| Customer Churn Rate | Moderate; depends on accurate tracking and analysis | CRM analytics and customer feedback platforms | Early identification of attrition risks affecting recurring revenue | Clear financial impacts driving focus on retention strategies | Use exit surveys to uncover root causes and act proactively |
| Employee Satisfaction/Engagement Score | Simple survey implementation; sensitive internal metric | Regular survey tools with anonymous feedback capabilities | Predicts customer service quality and potential turnover reduction | Correlates strongly with customer satisfaction and proactive management | Ensure anonymity and act quickly upon feedback to boost engagement |
Elevate Your Customer Service with Aidlify: Streamlining Support for Enhanced Performance
Mastering customer service performance indicators (CSPIs) is paramount to the success of any business. From understanding core metrics like Customer Satisfaction Score (CSAT) and Net Promoter Score (NPS) to optimizing operational efficiencies such as First Contact Resolution (FCR) and Average Resolution Time, this article has explored the key indicators you need to track. By focusing on these CSPIs, you gain valuable insights into customer perception, identify areas for improvement, and ultimately, drive business growth. Remember, these metrics aren't just numbers; they represent the voice of your customers and provide a roadmap for delivering exceptional experiences.
Improving customer satisfaction often goes hand-in-hand with optimizing your overall communication channels. If your team handles a significant volume of phone-based support, you might find value in exploring additional call center-specific metrics. For further insights into optimizing your call center and improving customer satisfaction, check out this comprehensive list of essential call center metrics: 10 Call Center Metrics to Track in 2025.
Effectively leveraging these insights requires the right tools. By understanding and actively managing your customer service performance indicators, you are not just improving individual interactions, you’re building stronger customer relationships, fostering loyalty, and driving sustainable business success.
Ready to transform your customer support and boost your key performance indicators? Aidlify, a powerful email ticketing system, helps you manage and optimize your customer service performance indicators by streamlining email support, improving FCR, and reducing resolution time. Explore how Aidlify can revolutionize your customer support operations and empower your team to deliver outstanding customer experiences.