Performance Targets for Customer Service: Boost Satisfaction & Results
April 30, 2025Mastering Customer Service Performance
Want to boost customer satisfaction and drive business growth? This listicle reveals six crucial performance targets for customer service. Learn how tracking metrics like First Contact Resolution (FCR), Customer Satisfaction Score (CSAT), Net Promoter Score (NPS), Average Handle Time (AHT), Customer Effort Score (CES), and Customer Retention Rate can pinpoint areas for improvement and optimize your support team's performance. Understanding and achieving these performance targets for customer service is essential for success in any competitive market.
1. First Contact Resolution (FCR)
First Contact Resolution (FCR) is a crucial performance target for customer service that measures the percentage of customer issues resolved during the initial interaction. This means the customer's problem is completely addressed without the need for follow-up calls, emails, or any other form of contact. As a core metric, FCR directly impacts customer satisfaction, agent productivity, and operational costs. By minimizing the time and effort spent on resolving a single issue, businesses can significantly improve efficiency and create a more positive customer experience. This is particularly important in today's fast-paced digital world, where customers expect quick and effective solutions. FCR deserves its place on any list of key performance targets because it provides a clear and measurable way to assess the effectiveness of customer service operations.

FCR is typically expressed as a percentage, calculated by dividing the number of issues resolved on the first contact by the total number of contacts received. This metric can be tracked across multiple channels, including phone, email, chat, and social media, providing a holistic view of customer service performance. Furthermore, segmenting FCR by issue type or department allows for more granular analysis, enabling businesses to identify specific areas for improvement within their customer service operations. For example, a company might find that their FCR for technical issues is significantly lower than for billing inquiries, highlighting the need for more specialized training or resources for the technical support team.
Features and Benefits of Tracking FCR:
- Measurable: Calculated as a percentage, providing a quantifiable assessment of performance.
- Multi-Channel Applicability: Trackable across various communication platforms, ensuring comprehensive analysis.
- Segmentable: Allows for analysis by issue type, department, or other relevant factors.
- Improved Customer Satisfaction: Directly correlated with higher CSAT scores, as customers appreciate quick and efficient resolutions.
- Cost Reduction: Minimizes repeat contacts, reducing operational costs associated with handling the same issue multiple times.
- Increased Agent Productivity: Frees up agents to handle more inquiries, leading to improved efficiency.
- Identification of Gaps: Highlights areas where processes, knowledge, or training need improvement.
Pros and Cons of Using FCR as a Performance Target:
- Pros: Directly correlates with higher customer satisfaction (CSAT) scores, reduces operational costs by minimizing repeat contacts, improves agent productivity and efficiency, identifies process or knowledge gaps in customer service operations.
- Cons: Can be difficult to measure accurately across all channels, may encourage agents to rush or provide incomplete solutions, some complex issues legitimately require multiple interactions, the definition of 'resolution' can vary between organizations.
Examples of Successful FCR Implementation:
Companies like Apple, Amazon, and Zappos have successfully implemented strategies to achieve high FCR rates. Apple's Genius Bar empowers its staff with extensive product knowledge and troubleshooting skills, enabling them to resolve issues on the spot. Amazon's customer service platform provides representatives with comprehensive access to order information and return/refund capabilities, facilitating quick resolutions. Zappos prioritizes customer satisfaction by eliminating time limits on customer calls and empowering representatives to thoroughly address concerns, resulting in an FCR rate above 75%.
Tips for Improving FCR:
- Invest in comprehensive agent training and knowledge management systems.
- Empower frontline agents with the authority to resolve common issues.
- Develop clear escalation paths for complex issues.
- Regularly review cases requiring multiple contacts to identify improvement opportunities.
- Use quality monitoring to ensure thorough resolution, not just quick handling.
When striving for optimal customer service, implementing FCR as a key performance indicator offers valuable insights and drives improvements. Learn more about First Contact Resolution (FCR) and discover how optimizing this metric can transform your customer service operations. By focusing on resolving issues efficiently during the initial interaction, businesses can enhance customer satisfaction, streamline operations, and achieve significant cost savings.
2. Customer Satisfaction Score (CSAT)
Customer Satisfaction Score (CSAT) is a key performance target for customer service that measures how satisfied customers are with a specific interaction, product, or service. It provides a direct measure of customer perception and experience quality, making it fundamental to understanding service effectiveness and pinpointing areas for improvement in customer-facing processes. Typically collected through post-interaction surveys, CSAT offers valuable insights into what's working well and where friction exists in the customer journey. This metric is invaluable for organizations striving to improve customer loyalty and reduce churn.

CSAT is usually measured on a 5-point or 10-point scale, often presented as the percentage of respondents selecting the top satisfaction ratings (e.g., 4 and 5 on a 5-point scale). It can be calculated for overall satisfaction or for specific aspects of the service, such as speed of resolution, agent helpfulness, or product quality. Furthermore, CSAT can be measured in real-time immediately following an interaction or through periodic surveys for a broader perspective. This flexibility allows businesses to tailor their CSAT programs to their specific needs and customer touchpoints.
Why CSAT Deserves Its Place in the List of Performance Targets:
CSAT directly reflects the voice of the customer, providing actionable feedback that can drive service improvements. Its simplicity and ease of implementation make it accessible to organizations of all sizes. By tracking CSAT over time, businesses can monitor the impact of changes to their service processes and identify trends in customer sentiment. This data-driven approach empowers organizations to make informed decisions and prioritize initiatives that enhance the customer experience.
Pros:
- Provides direct customer feedback on service quality.
- Easy for customers to understand and complete.
- Can be implemented across multiple touchpoints (e.g., email, chat, phone).
- Allows for benchmark comparison across time periods, teams, or industry standards.
- Identifies specific pain points in the customer journey.
Cons:
- Subject to response bias (dissatisfied customers are often more likely to respond).
- Often reflects recent experiences rather than the overall customer relationship.
- Cultural differences can influence how ratings are given.
- Survey fatigue can reduce response rates and data quality.
Examples of Successful Implementation:
- Ritz-Carlton uses daily "lineup" meetings where CSAT feedback is reviewed and acted upon immediately, empowering employees to address customer concerns promptly.
- Apple uses post-support satisfaction surveys that trigger manager reviews for any score below 8/10, ensuring accountability and driving continuous improvement.
- Southwest Airlines emphasizes CSAT as a key metric for employee performance evaluation and recognition, aligning individual goals with overall customer satisfaction objectives.
Tips for Effective CSAT Implementation:
- Keep surveys short and focused to improve response rates.
- Ask for feedback at the right moment in the customer journey (e.g., immediately after a support interaction).
- Follow up on negative feedback quickly to resolve issues and demonstrate a commitment to customer satisfaction.
- Segment CSAT data by customer type, issue category, or channel to gain deeper insights into specific customer segments.
- Share CSAT results with the entire team to create a customer-centric culture and promote shared ownership of customer satisfaction.
Learn more about Customer Satisfaction Score (CSAT)
Organizations seeking to optimize their customer service performance and improve the overall customer experience should prioritize CSAT as a crucial performance target. By actively monitoring and responding to customer feedback, businesses can identify areas for improvement, enhance service quality, and build stronger customer relationships. This proactive approach is essential for achieving sustainable growth and success in today's competitive landscape.
3. Net Promoter Score (NPS)
Net Promoter Score (NPS) is a crucial performance target for customer service, measuring customer loyalty and their likelihood to recommend your company, product, or service. It boils down to a single, straightforward question: "How likely are you to recommend us to a friend or colleague?" Customers respond on a scale of 0 to 10, categorizing them as Detractors (0-6), Passives (7-8), and Promoters (9-10). Your NPS is then calculated by subtracting the percentage of Detractors from the percentage of Promoters, resulting in a score ranging from -100 to +100. This simple metric provides a powerful snapshot of customer sentiment and serves as a valuable performance target for customer service teams.
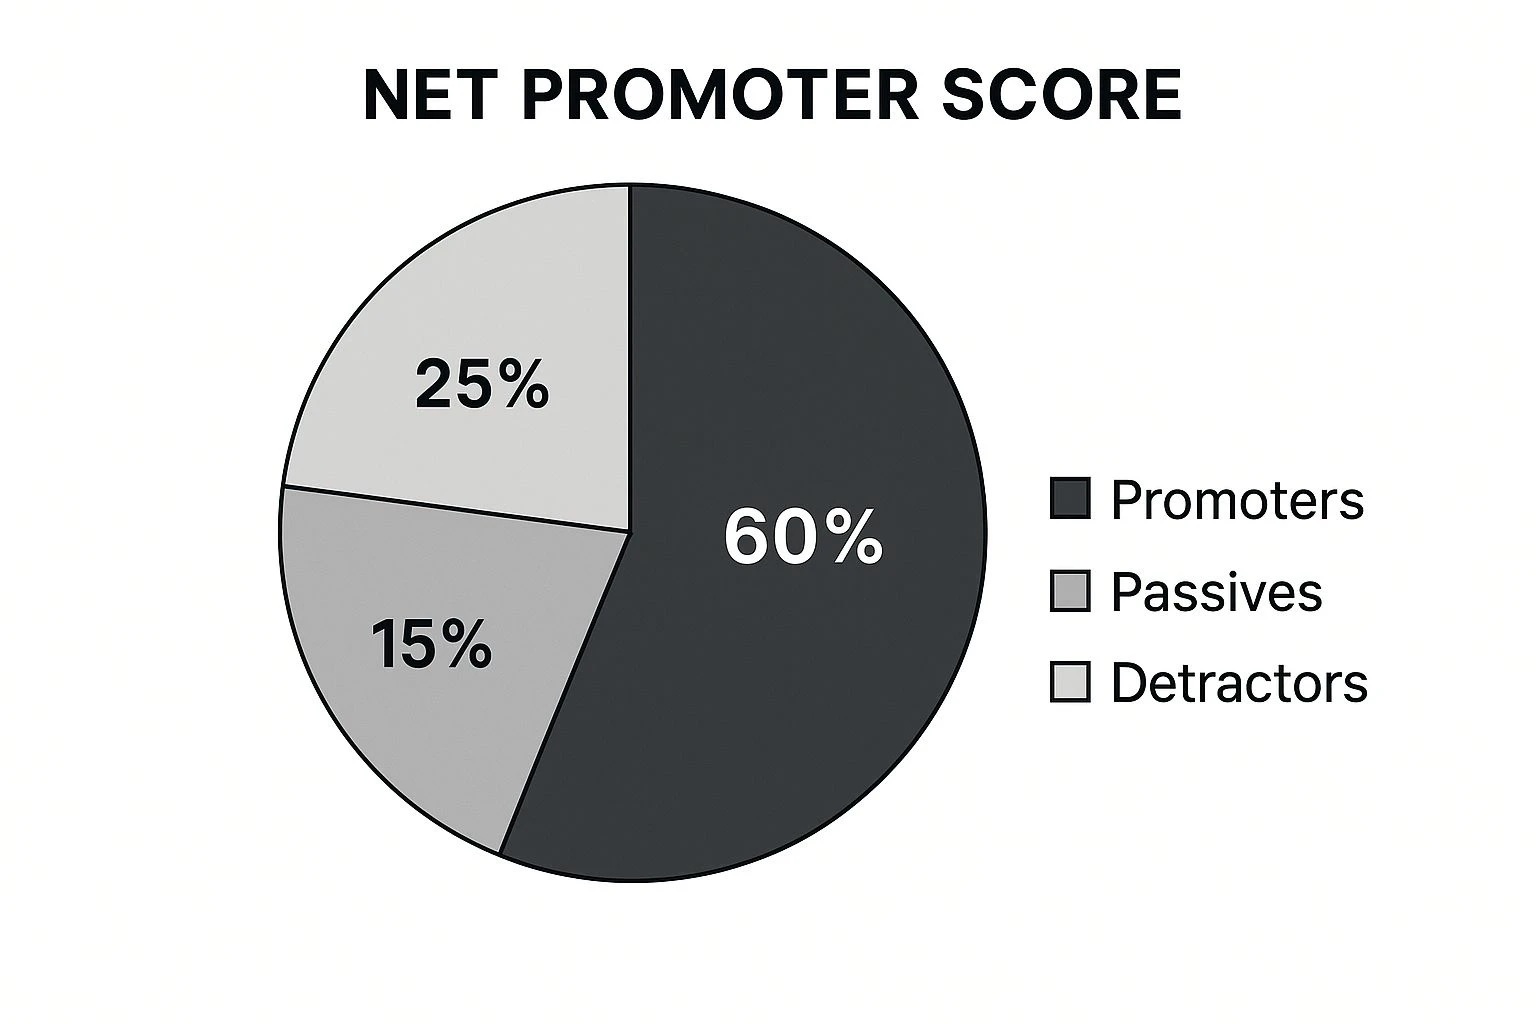
The infographic above visually represents the NPS calculation and its correlation to business growth. The bar chart clearly illustrates the distribution of Detractors, Passives, and Promoters, and how their proportions impact the overall NPS score. The accompanying growth chart reinforces the strong correlation between a high NPS and increased revenue growth, emphasizing its importance as a key performance indicator.
This simple methodology makes NPS easy to implement and understand, providing a clear benchmark that can be compared across industries. Its simplicity also often leads to higher response rates than longer, more complex surveys. NPS frequently includes an open-ended follow-up question allowing for deeper qualitative insights into the reasons behind the score. Furthermore, its flexibility allows for measurement at both the relationship level (overall company experience) and the transaction level (specific interaction), providing valuable data for various aspects of customer service performance.
Why NPS Deserves Its Place in Performance Targets for Customer Service:
NPS offers several compelling advantages as a performance target. It strongly correlates with business growth and customer loyalty, making it a relevant metric for organizations focused on long-term success. Its simplicity makes it easy for executives to understand and track over time. It provides both a quantitative score and qualitative feedback, offering a more holistic view of customer sentiment. Finally, its widespread adoption enables benchmarking against competitors and industry best practices.
Examples of Successful NPS Implementation:
- Apple consistently maintains NPS scores above 70 across its product lines, demonstrating its success in fostering customer loyalty and advocacy.
- USAA consistently achieves a high NPS (70+) in the highly competitive financial services sector by prioritizing exceptional customer service.
- Costco's member-focused business model contributes to its impressive NPS scores, typically above 60, highlighting the link between customer-centricity and high promoter scores.
Pros and Cons of Using NPS:
Pros:
- Strong correlation with business growth and customer loyalty.
- Easy to understand and track.
- High response rates due to simplicity.
- Provides both quantitative and qualitative feedback.
- Widely adopted, allowing for benchmarking.
Cons:
- Can oversimplify complex customer relationships.
- Doesn't always pinpoint specific reasons for customer sentiment.
- Cultural biases can influence scoring.
- May overemphasize Promoters while neglecting the potential of Passives.
Actionable Tips for Utilizing NPS:
- Close the Loop: Implement a closed-loop process to follow up with Detractors, address their concerns, and turn negative experiences into positive ones.
- Company-Wide Sharing: Share NPS feedback across all departments to drive company-wide improvements and foster a customer-centric culture.
- Strategic Measurement: Measure NPS at key moments in the customer journey to identify pain points and opportunities for optimization.
- Holistic Approach: Combine NPS with other customer experience metrics to gain a more comprehensive understanding of customer satisfaction.
- Focus on Trends: Track NPS trends over time to identify patterns and measure the effectiveness of implemented changes.
When and Why to Use NPS:
NPS is particularly useful for businesses handling high volumes of inquiries, SaaS companies, digital service providers, and anyone utilizing email for customer support. Its simplicity makes it an efficient way to gauge customer satisfaction and identify areas for improvement. Tracking NPS over time allows organizations to measure the impact of customer service initiatives on overall customer loyalty and predict future growth. The insights gleaned from NPS can be instrumental in shaping customer service strategies, optimizing workflows, and improving overall customer experience. This makes it a valuable performance target for customer service teams seeking to enhance customer satisfaction and drive business growth.
4. Average Handle Time (AHT)
Average Handle Time (AHT) is a key performance target for customer service that measures the total duration of a customer interaction. This includes talk time, hold time, and any after-call work or documentation time. AHT is a crucial metric for assessing the efficiency of your customer service operations, informing resource allocation, and finding the right balance between speed and quality. While traditionally a mainstay of call centers, AHT is now equally relevant to other channels like chat, email, and social media. It deserves its place on this list because it offers valuable insights into operational effectiveness and can significantly impact customer satisfaction and the bottom line.
AHT is calculated by dividing the total handling time for all interactions by the number of interactions handled. It's typically measured in minutes and seconds and often broken down into its component parts: talk time, hold time, and wrap-up time. This granular view allows for a more precise analysis of where time is being spent. Furthermore, AHT can be tracked at various levels, from individual agents to entire teams or the organization as a whole, enabling targeted interventions and performance improvements. It's important to remember that AHT varies significantly by industry and the complexity of the issues being addressed. For example, a technical support line troubleshooting complex software issues will naturally have a higher AHT than a retail store handling simple order inquiries.
Features and Benefits of Monitoring AHT:
- Calculated by: Total handling time / Number of interactions
- Measurement: Minutes and seconds
- Components: Talk time, hold time, wrap-up time
- Tracking Levels: Individual, team, organization
- Benefits: Impacts operational costs, identifies training needs, reveals process bottlenecks, enables workload forecasting
Pros:
- Cost Efficiency: Directly influences operational costs and staffing requirements.
- Training Opportunities: Helps identify areas where agent training can improve efficiency.
- Process Improvement: Can indicate process bottlenecks or system issues hindering performance.
- Resource Planning: Enables accurate workload forecasting and efficient scheduling.
Cons:
- Quality Concerns: Overemphasis on AHT can lead to rushed service and reduced customer satisfaction.
- Variability: Different issue types require different handle times, making a blanket target problematic.
- Metric Conflicts: May conflict with other important metrics like First Contact Resolution (FCR).
- Agent Pressure: Can create unhealthy pressure on agents to prioritize speed over customer needs.
Examples of Successful AHT Implementation:
- T-Mobile: Their Team of Experts model eliminated AHT targets, focusing instead on resolution. This resulted in higher customer satisfaction scores.
- American Express: Balances AHT with quality metrics to ensure efficiency doesn't compromise service excellence.
- Zappos: Their famous 10+ hour customer call demonstrated their commitment to customer satisfaction over strict adherence to AHT.
Actionable Tips for Optimizing AHT:
- Segmentation: Segment AHT targets by issue type or complexity for more realistic goals.
- Diagnostic Tool: Use AHT as a diagnostic tool to identify areas for improvement, not just a performance metric.
- Balance with Quality: Balance AHT targets with quality and resolution metrics for a holistic approach.
- Training and Tools: Invest in agent training and knowledge management tools to improve efficiency naturally.
- Outlier Analysis: Review outlier cases (both high and low AHT) to identify systemic issues affecting handle time.
Learn more about Average Handle Time (AHT)
When aiming to improve your performance targets for customer service, understanding and effectively managing AHT is crucial. It provides a valuable lens through which to view operational efficiency and identify opportunities for improvement, ultimately benefiting both the business and the customer. Properly implemented, AHT tracking can lead to streamlined processes, reduced costs, and enhanced customer satisfaction. However, it’s vital to avoid the trap of prioritizing speed over quality and to remember that AHT is just one piece of the customer service puzzle. Organizations need to strike a balance between efficiency and effectiveness to truly deliver exceptional customer experiences.
5. Customer Effort Score (CES)
Customer Effort Score (CES) is a crucial performance target for customer service that measures the ease with which customers can interact with your business and resolve their issues. It directly addresses how much effort a customer has to expend to get their question answered, problem solved, or request fulfilled. This metric deserves a place on this list because, unlike traditional customer satisfaction surveys, CES focuses on reducing friction and streamlining processes, directly impacting customer loyalty and repeat business. As part of a comprehensive set of performance targets for customer service, CES provides valuable insights into areas for improvement and optimization.
Instead of focusing on exceeding expectations and "delighting" customers, CES operates on the principle that reducing customer effort is a more significant driver of loyalty. Customers simply want a quick and easy resolution to their issues. The measurement typically involves asking customers to rate their agreement with a statement like, "The company made it easy for me to handle my issue," on a scale, usually from 1 (strongly disagree) to 5 (strongly agree) or 1 to 7. A lower score indicates lower effort and, consequently, higher predicted customer loyalty.
How CES Works:
CES is typically measured after a specific interaction or touchpoint in the customer journey, such as after a support call, email exchange, or online chat. This allows businesses to pinpoint areas within their service processes that require streamlining. It focuses on the ease of the interaction, rather than subjective feelings of satisfaction or happiness. This focus allows for more actionable insights and process improvements. CES can be applied to specific channels (e.g., phone support, email support) or across the entire customer service experience.
Features and Benefits:
- Predictive Power: CES has been shown to be a stronger predictor of customer loyalty and repeat business than traditional customer satisfaction metrics.
- Actionable Insights: CES provides clear direction for process improvement by identifying specific friction points in the customer journey.
- Focus on Efficiency: It encourages businesses to focus on removing obstacles and streamlining processes rather than adding "delighters" that may not significantly impact loyalty.
- Cost-Effective Improvement: Improving CES often involves relatively low-cost process adjustments compared to large-scale initiatives aimed at maximizing customer delight.
Pros:
- Strong predictor of customer loyalty and repeat business
- More actionable than satisfaction metrics in identifying process friction
- Focuses on removing obstacles rather than adding "delighters"
- Typically requires less investment to improve than delight-focused initiatives
Cons:
- Relatively newer metric with less historical benchmark data
- May not capture the emotional aspects of customer experience
- Can be difficult to attribute to specific process elements if not implemented carefully
- Doesn't necessarily account for situations where effortful engagement is positive (e.g., complex financial planning)
Examples of Successful Implementation:
- Amazon's 1-Click ordering: This dramatically reduced the effort required to make a purchase, contributing significantly to Amazon's success.
- USAA's mobile app: Allows insurance claims submission with a few photos, simplifying a traditionally complex process.
- Slack's intuitive interface: Significantly reduced the effort of workplace communication, making collaboration easier.
Actionable Tips for Using CES as a Performance Target:
- Map the Customer Journey: Identify high-effort touchpoints by visually mapping the customer’s experience from start to finish.
- Timely Feedback: Ask for CES feedback immediately after key interactions to capture accurate and relevant data.
- Segmentation: Segment CES scores by customer type and issue category to uncover specific pain points.
- Collaboration: Create cross-functional teams to address high-effort processes, as improvements often require input from multiple departments.
- Holistic Approach: Consider both digital and human interaction points when measuring and improving effort.
Popularized By:
- Matthew Dixon (co-author of The Effortless Experience)
- CEB (now Gartner)
- Harvard Business Review article "Stop Trying to Delight Your Customers"
By focusing on reducing customer effort, businesses can build loyalty, increase repeat business, and improve their overall customer service performance. CES provides a valuable framework for identifying and addressing friction points, leading to a more seamless and efficient customer experience.
6. Customer Retention Rate
Customer Retention Rate is a crucial performance target for customer service, directly impacting a company's bottom line and reflecting its ability to foster long-term customer relationships. It measures the percentage of customers who continue doing business with a company over a specific period, such as a month, quarter, or year. This metric deserves its place on this list because it provides a clear link between customer service quality and financial success, making it a powerful justification for service investments and a key component of any strategy aiming for sustainable growth. As a key performance target for customer service, it offers invaluable insights into the effectiveness of service experiences in driving customer loyalty. Learn more about Customer Retention Rate
How It Works:
The Customer Retention Rate is calculated using the following formula: ((End Customers - New Customers) / Start Customers) × 100. This essentially tracks the proportion of customers at the beginning of a period who remain customers at the end of that period, excluding any newly acquired customers. The resulting percentage represents the company's ability to hold onto its existing customer base.
Features and Benefits:
- Segmented Analysis: Retention rates can be segmented by various factors like customer value tiers (e.g., gold, silver, bronze), product lines, or demographics, allowing for targeted service improvements. This granular approach allows businesses to pinpoint areas where retention is strong and where it's faltering for specific customer groups.
- Churn Analysis Integration: Examining retention rates alongside churn reasons reveals the underlying causes of customer attrition. This allows customer service teams to identify service-related issues driving customers away and implement effective solutions.
- Weighted by Customer Value: Focusing on retaining high-value customers is often more impactful on revenue. Weighting the retention rate by customer value helps prioritize service efforts on these key segments.
- Long-Term Perspective: Unlike some metrics that focus on immediate interactions, customer retention rate reflects the cumulative impact of service experiences over time, offering a more holistic view of customer satisfaction.
Pros:
- Directly linked to revenue stability and profitability.
- Provides clear financial justification for service investments.
- Reflects cumulative impact of service experiences over time.
- Helps identify customer segments at risk.
- Creates organizational focus on long-term relationships, not just transactions.
Cons:
- Can be influenced by external factors outside of customer service control (e.g., competitive pricing, market changes).
- There's often a lag time between service issues and their impact on retention.
- Different business models have different natural retention rates, making comparisons difficult.
- Measuring only aggregate retention can mask issues within specific segments.
- Not all customers are equally valuable to retain.
Examples of Successful Implementation:
- Apple: Boasts retention rates exceeding 90% in many markets, attributed to their strong ecosystem integration and consistently exceptional customer service.
- USAA: Maintains a remarkable 97%+ retention rate through highly personalized service models tailored to the military community.
- Amazon Prime: Achieves a 93% first-year renewal rate, supported by their responsive customer service and continuous delivery of value through various benefits.
Actionable Tips for Using Customer Retention Rate as a Performance Target:
- Track Changes After Interactions: Monitor retention rate fluctuations following service interactions to directly measure the impact of service quality on customer loyalty.
- Proactive Retention Programs: Implement proactive programs targeted at at-risk customer segments identified through retention analysis.
- Exit Surveys: Conduct exit surveys to gather valuable insights into service-related churn factors.
- Service Recovery: Develop robust service recovery processes designed to turn negative experiences into opportunities for building customer loyalty.
- Focus on Profitable Segments: Prioritize retention efforts on the most profitable customer segments to maximize return on investment.
When and Why to Use This Approach:
Customer Retention Rate is a valuable performance target for any business focused on long-term sustainability and profitability. It's particularly relevant for:
- Customer Support Teams: Provides direct feedback on the effectiveness of their support efforts in retaining customers.
- IT Help Desk Professionals: Helps assess how well IT support contributes to overall customer satisfaction and retention.
- Businesses Handling High Volume Inquiries: Offers insights into the efficiency and effectiveness of service delivery at scale.
- SaaS Companies and Digital Service Providers: Crucial for understanding subscriber churn and optimizing service models for retention.
By focusing on Customer Retention Rate as a performance target, organizations can drive customer loyalty, enhance revenue stability, and build a stronger foundation for sustainable growth. It provides a clear and measurable link between customer service quality and business success, making it an indispensable metric for any customer-centric organization.
6 Key Customer Service Performance Targets Comparison
| Performance Target | Implementation Complexity 🔄 | Resource Requirements 💡 | Expected Outcomes 📊 | Ideal Use Cases | Key Advantages ⭐ |
|---|---|---|---|---|---|
| First Contact Resolution (FCR) | Medium - requires multi-channel tracking and clear resolution definitions | High - agent training and knowledge systems needed | Higher customer satisfaction, cost reduction, improved agent efficiency | Customer service with frequent inquiries | Reduces repeat contacts, identifies knowledge gaps, boosts productivity |
| Customer Satisfaction Score (CSAT) | Low - simple surveys across touchpoints | Low - survey tools and analysis platforms | Direct feedback on service quality and specific pain points | Measuring satisfaction per interaction | Easy to understand, enables benchmarking, actionable feedback |
| Net Promoter Score (NPS) | Low - single-question survey, scalable | Low - survey system plus follow-up | Measures loyalty and growth potential, benchmarkable | Tracking overall customer loyalty | Correlates with growth, simple, combines quantitative and qualitative data |
| Average Handle Time (AHT) | Medium - detailed time tracking per interaction | Medium - monitoring tools and workforce management | Efficiency insights, cost control, workload forecasting | Call centers and digital support channels | Identifies bottlenecks, aids scheduling, highlights training needs |
| Customer Effort Score (CES) | Low to Medium - needs targeted survey post-interaction | Low - focused surveys, journey mapping | Predicts loyalty by measuring friction in service | Process improvement and friction reduction | Actionable for process refinement, strong loyalty predictor |
| Customer Retention Rate | Medium - requires longitudinal customer data and segmentation | Medium to High - CRM systems and analytics | Revenue stability, long-term relationship evaluation | Subscription and loyalty-driven businesses | Links to profitability, identifies at-risk segments, justifies service investment |
Elevating Your Customer Service Game
This article explored six key performance targets for customer service: First Contact Resolution (FCR), Customer Satisfaction Score (CSAT), Net Promoter Score (NPS), Average Handle Time (AHT), Customer Effort Score (CES), and Customer Retention Rate. By monitoring and strategically addressing these metrics, your team can gain valuable insights into the customer journey and identify areas ripe for improvement. Remember the core takeaway: effectively managing these performance targets for customer service empowers you to understand not just what is happening with your customer interactions, but why.
The most important actions you can take now include establishing clear benchmarks for each metric, regularly tracking your performance, and implementing targeted strategies for improvement. For example, improving FCR often involves empowering agents with better knowledge bases and streamlining internal processes. Similarly, focusing on CES can reveal pain points in the customer journey that, when addressed, lead to greater satisfaction and loyalty. Think of these performance targets as your navigational tools in the ever-evolving landscape of customer expectations.
Mastering these concepts isn't just about checking boxes; it's about building a customer-centric culture that drives tangible business results. Improved customer satisfaction translates to increased loyalty, positive word-of-mouth referrals, and ultimately, a healthier bottom line. In a competitive market, exceptional customer service becomes a powerful differentiator. Leveraging tools like Aidlify can further optimize your customer service operations and help you achieve these performance targets for customer service effectively in 2025 and beyond. By investing in your customer service team and empowering them with the right tools and strategies, you’re investing in the future success of your business. Embrace the challenge and watch your customer relationships flourish.